Plumbing and Drainage Plus
Trust HomeServe’s plumbing and drainage cover, just 50p a month in the first year. *50p a month in year 1 with £30 excess. New customers, homeowners only. T&Cs apply.
Find out more13.03.26 Cheam Water Treatment Works – Increased water hardness
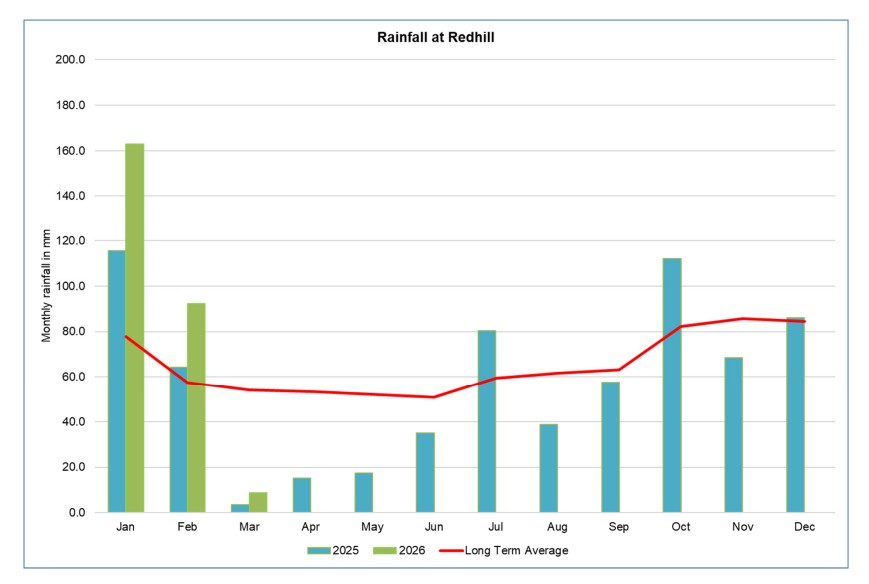
Read moreRainfall and rivers are key to us being able to supply you with a high-quality supply of water.
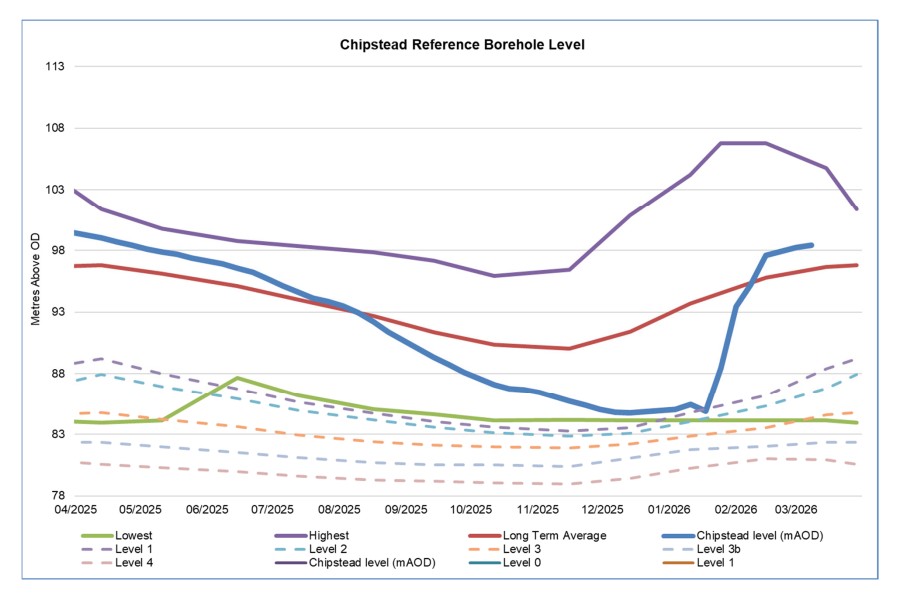
Groundwater levels – 1.75m above LTA
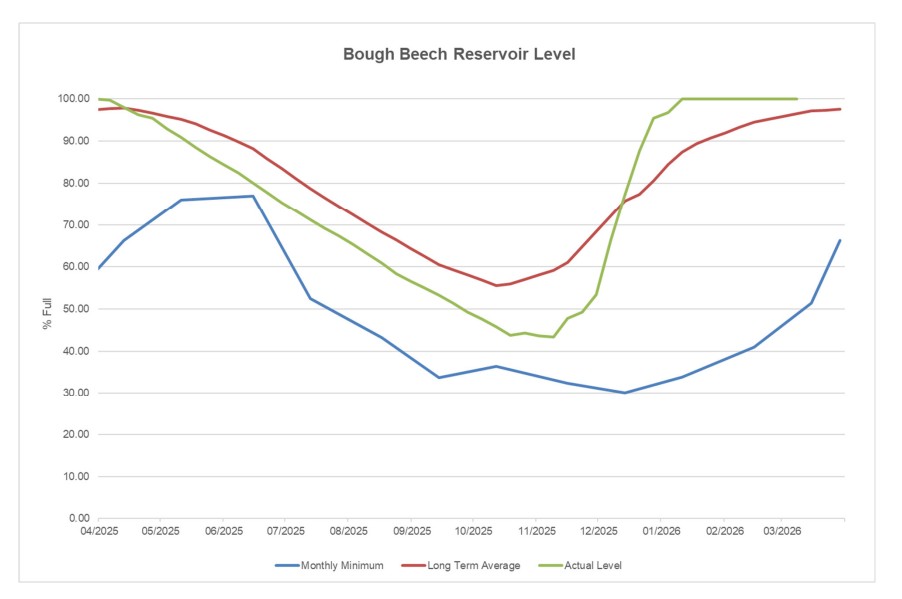
Bough Beech Reservoir level – 100% full
Like many water companies, we depend on winter rainfall for the water we supply to our customers. About 85% of our water comes from groundwater sources, which recharge over the winter (usually from October to March) when there is less plant growth and evaporation. The remaining 15% comes from Bough Beech reservoir. This water resource is abstracted from the River Eden, usually between October and March and then stored in the reservoir to be used throughout the year.
On 07 May 2025, the Environment Agency set out that the UK had the driest spring start since 1956. Our water resources were able to recharge well at the beginning of winter, and we are in a relatively healthy position going into the summer and we are not planning to introduce hosepipe bans.
Working across the industry, our stakeholders (such as the Environment Agency and Natural England) are prompting us all to understand that the environment is especially vulnerable to prolonged dry weather. This highlights that our work to reduce demand (and therefore abstraction) together with supporting resilient catchments is vital as we plan for the future.
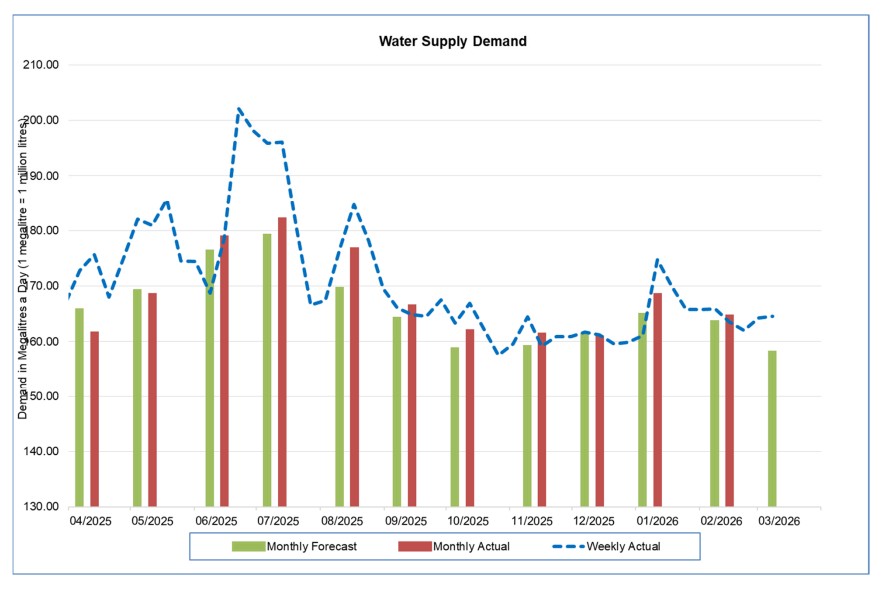
We usually supply 160 million litres of water every day and we have seen this rise to 200 million litres on some days this year.
Whilst we continue to reduce our leakage to its lowest ever levels, it’s also important for everyone to be conscious of how much water they use and how they can be more efficient.
We have a wealth of tips and information on saving water, as well as tools to help our customers reduce their bill and to order free water saving devices.
More information can be found below about rainfall and our resources levels – this is updated regularly.

As of 8th March 2026.
As of 8th March 2026.
As of 8th March 2026.
As of 8th March 2026.
To download, please click on the spreadsheet document. This is a ZIP format file containing the full set of all available data in a multi-sheet Excel format spreadsheet. (data updated monthly)
Trust HomeServe’s plumbing and drainage cover, just 50p a month in the first year. *50p a month in year 1 with £30 excess. New customers, homeowners only. T&Cs apply.
Find out more